Measuring Merbok Storm Impacts
Lands in Focus: Presented by Calista Land & Natural Resources Department
Storyknife, Nov/Dec 2022 edition
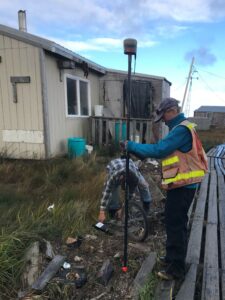
Division of Mining, Land and Water staff conducting post-storm surveys in Newtok. Photo courtesy Alaska Dept. of Natural Resources
We know Typhoon Merbok was a historic storm but how does it compare with past storms in our region? What was done to gather information for threatened communities in our region?
Lands in Focus posed these questions to Jaci Overbeck, regional geospatial coordinator for NOAA’s Office for Coastal Management, and Leslie Jones, geospatial information officer for the Alaska Geospatial Office. Their responses are summarized below.
How do you describe the severity of this storm?
In Golovin, where we have historical documentation on floods going back to the early 1900s, we can say this event was on par with a 100-year storm, since the last storm of a similar magnitude occurred in 1913.
The severity of flooding from the storm has been identified for each community in an online mapping tool available here: https://bit.ly/merbokflooding.
According to the mapping tool, Y-K communities that experienced major flooding during the storm were Hooper Bay, Chevak, Newtok and Napakiak. Communities with moderate flooding were Kotlik, Scammon Bay, Nightmute and Tununak.
What communities did you visit in the Y-K Region?
Field crews deployed to western Alaska after the storm faced a myriad of weather challenges, reducing the number of communities that could be reached.
In the Y-K Region, field crews were able to reach and collect data in eight communities: Hooper Bay, Newtok, Bethel, Chevak, Tununak, Tuntutuliak, Kongiganak and Goodnews Bay. They were also able to travel and speak to residents in Napakiak and Napaskiak.
We want to thank all the communities we traveled to for allowing our teams to be on site during a very difficult time. Also, the local Fish and Wildlife Service staff in Bethel for providing boat transport on a bad weather day.
Are there other communities where you are able to use satellite imagery to help determine impacts?
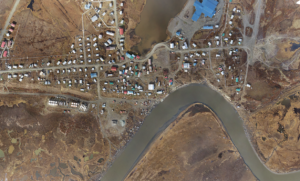
Post-Merbok drone imagery of Chevak gathered by the UAF Arctic Coastal Geosciences Lab. More images available here.
Yes. Post-storm satellite imagery is currently available for 35 communities impacted by the storm, and will help determine impacts to communities where high-water marks and flood data were not collected.
Aerial and satellite imagery may allow us to quantify erosion impacts from this event. The Alaska Geospatial Office is working to gain access to pre-storm imagery for all communities. This kind of data and information is important for future mitigation projects or community planning.
What suggestions to you have for communities for record keeping?
High water mark data is used to create post-storm community flood maps to identify areas that flooded and at what depth. This field data is the most valuable data, but requires personnel, travel and funding for trained surveyors. Also, evidence of high water marks is easily lost with time and cleanup after events.
Contact jacquelyn.overbeck@noaa.gov to report high water markers in need of surveying. Communities which flooded but did not have a post-storm survey are encouraged to set markers that can be surveyed at a later date.
Information on how to preserve high water marks is available from the U.S. Geological Survey and U.S. Corps of Engineers-Alaska District. Really it comes down to pounding a stake in the ground at the extent of a debris line or a nail with flagging in the side of telephone poles, or other structures, and writing the date or other event information.